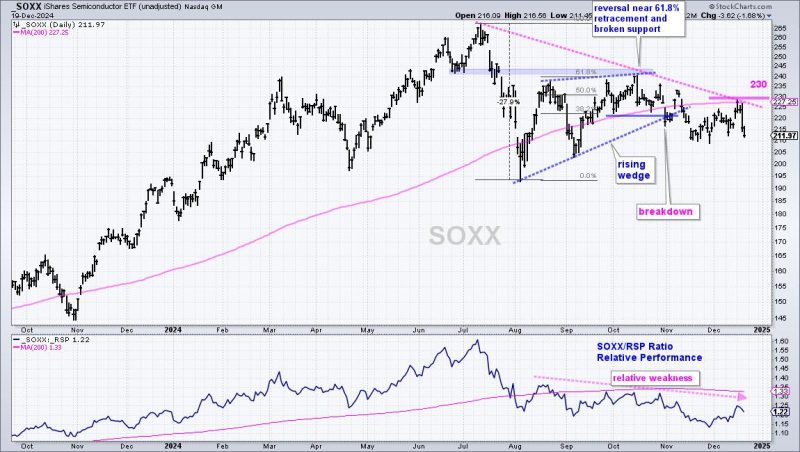
SPY and QQQ remain in long-term uptrends, but three big negatives are currently hanging over the stock market. Two negatives are tied to important cyclical groups and the third is reminiscent of summer 2022. The semiconductor business is cyclical and the Semiconductor ETF (SOXX) is one of the weakest industry group ETFs. Housing is an important part of the domestic economy and the Home Construction ETF (ITB) broke down. On top of this, the 10-yr Treasury Yield is breaking out and appears headed back to 5%, just as it did in summer 2022. The charts below tell the story.
The Semiconductor ETF (SOXX) remains in a long-term downtrend. The chart below shows SOXX breaking down in July, forming a rising wedge into October and breaking wedge support at the end of October. Notice how this wedge retraced around 61.8% of the July decline and met resistance near the July support break. This advance was a counter-trend bounce and the wedge break signals a continuation lower. This is negative for semis, and by extension, the Technology sector and QQQ.
We recently covered weakening breadth and oversold conditions in two breadth indicators. These indicators could remain oversold. As such, we are setting bullish thresholds to distinguish between a robust bounce and a dead cat bounce. Click here to take a trial to Chart Trader and get two bonus reports!
The Home Construction ETF (ITB) failed to hold its late November breakout and reversed its long-term uptrend this month. ITB surged in November with a momentum thrust, similar to the July breakout. The July breakout held and ITB hit new highs in mid October. The November breakout, in contrast, failed as the ETF broke support and the 200-day SMA in December. ITB is in a long-term downtrend, which is negative for housing, and by extension, the Consumer Discretionary sector and the broader market.
The 10-yr Treasury Yield is on the rise as it broke out of a 13 month falling channel, which was in place since November 2023. This breakout targets a move toward the October 2023 high around 5%. The chart below shows the falling channel extending from October 2023 to December 2024. TNX hit the upper line in late November and fell rather sharply into early December. The yield firmed in the 41-42 area (4.1%-4.2%) as a falling flag took shape. TNX broke out of the flag on December 11th and followed through with a channel breakout this week. This move reverses the long-term downtrend and argues for a higher 10-yr Treasury Yield. Much like summer 2022, this could weigh on stocks.
Even though SPY and QQQ are still in long-term uptrends, this negative trifecta will likely weigh on the market. Small-caps and mid-caps were slammed this week and breadth has been deteriorating for a few weeks. Our breadth models at TrendInvestorPro have yet to signal a bear market, but we will watch them closely in the coming days and weeks.
