Popular
‘Aspirations of 1.4 billion’: India celebrates as first...
Iran’s defense minister goes to China on first...
This photographer is celebrating tiny creatures through close-up...
Zelensky and European rights body establish tribunal to...
They call it ‘Merzcron’: The EU’s Franco-German engine...
Find Highest Probability Counter-Trend Setups
Settlement of Tranche 1 Share Placement
Cobalt Prices Surge as DRC Extends Export Ban...
​Copper​ Market Hit by Major Supply Squeeze as...
Exploring Mining’s Silver Discussion with Apollo Silver, and...
  • Home
HotInvestingPilots.com
  • Politics
  • World News
  • Stock
  • Investing
Stock

How to Trade Erratic Uptrends – An Example and Setup using IWM

by January 4, 2025
written by January 4, 2025

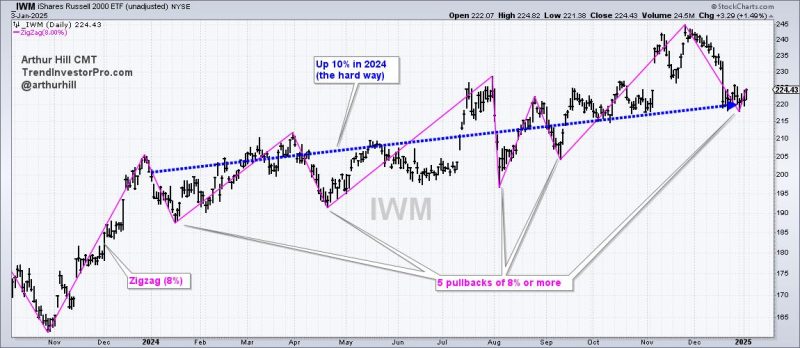
The Russell 2000 ETF managed a double-digit gain in 2024, but did it the hard way with several deep pullbacks. Pullbacks within uptrends are opportunities and we can find such opportunities using %B.

The chart below shows the Russell 2000 ETF (IWM) with the Zigzag(8) indicator. This indicator changes direction when there is a move greater than 8%, which means it ignores price moves that are less than 8%. I am showing this indicator to highlight five pullbacks of 8% or more in 2024. That’s a lot. In contrast, the S&P 500 SPDR (SPY) only experienced one 8+ percent pullback in early August.

Overall, IWM advanced 10% in 2024. That seems like a good year, but it was a “hard” 10% when we include the five 8+ percent pullbacks. This is simply the nature of small-cap stocks. They are less “trendy” than large-caps and have higher betas, making them more susceptible to wider fluctuations. Traders need to consider this when trading small-caps. As noted in Chart Trader this week, we see similar price action in the S&P 500 EW ETF (RSP) and S&P MidCap 400 SPDR (MDY).

Click here to take Chart Trader trial and get immediate access.

Buying upside breakouts is probably not the best strategy for trading IWM. Instead, traders should consider pullbacks and mean-reversion opportunities. We can identify such opportunities using Bollinger Bands (20,2) and %B (20,2). The middle line on the Bollinger Bands is the 20-day SMA and the bands are two standard deviations above and below. A close below the lower band means price fell two standard deviations and this creates an oversold condition.

Chartists can quantify oversold conditions using %B, which falls below 0 when the close is below the lower Bollinger Band. The blue lines on the chart above show %B dipping below 0 four times in 2024. Note that I would also only look for oversold conditions when price is above the 200-day SMA (long-term uptrend). When the bigger trend is up, a close below the lower Bollinger Band signals an oversold condition that can lead to a bounce.

December was a rough month for many stocks and ETFs. Even so, the weight of the evidence remains bullish for stocks and these pullbacks look like corrections within bigger uptrends. This week’s reports and videos focused on long-term breadth indicators, short-term oversold breadth, leading ETFs and a dozen ETFs with tradable pullbacks.

Click here to take a Chart Trader trial and get immediate access.

///////////////////////////////////////////////
0 comment
0
FacebookTwitterPinterestEmail

previous post
Cameco Faces Uranium Production Halt at JV Inkai Following Regulatory Delay
next post
These Riskier Areas Start the New Year RALLY!

Related Articles

Find Highest Probability Counter-Trend Setups

June 26, 2025

Offense vs. Defense: How Geopolitical Tensions Shape Market...

June 25, 2025

How to Use Fibonacci Retracements to Spot Key...

June 25, 2025

Shifting Tides in the Stock Market: A New...

June 25, 2025

The Best Five Sectors, #24

June 24, 2025

This Week’s Earnings Watch: Turnarounds and Momentum Plays

June 24, 2025

AI Stocks Ignite Again—Where Smart Money is Heading...

June 24, 2025

US Strikes Iran: What Comes Next For Stocks?

June 23, 2025

Lagging Mid-cap ETF Hits Moment of Truth

June 23, 2025

The NASDAQ 100, On The Brink Of A...

June 22, 2025

Stay updated with the latest news, exclusive offers, and special promotions. Sign up now and be the first to know! As a member, you'll receive curated content, insider tips, and invitations to exclusive events. Don't miss out on being part of something special.


By opting in you agree to receive emails from us and our affiliates. Your information is secure and your privacy is protected.

Recent Posts

  • ‘Aspirations of 1.4 billion’: India celebrates as first International Space Station mission gets underway

    June 26, 2025
  • Iran’s defense minister goes to China on first reported foreign trip since conflict with Israel

    June 26, 2025
  • This photographer is celebrating tiny creatures through close-up images

    June 26, 2025
  • Zelensky and European rights body establish tribunal to allow prosecution of Russian leaders

    June 26, 2025
  • They call it ‘Merzcron’: The EU’s Franco-German engine is powering up once again

    June 26, 2025
  • About us
  • Contact us
  • Privacy Policy
  • Terms & Conditions

Copyright © 2025 hotinvestingpilots.com | All Rights Reserved

HotInvestingPilots.com
  • Politics
  • World News
  • Stock
  • Investing