While the major equity averages are certainty up year-to-date, we’re detecting a growing number of signs of leadership rotation. As the Magnificent 7 stocks have begun to falter, with charts like Apple Inc. (AAPL) taking on a less-than-magnificent luster in February, we’ve identified ten key stocks and ETFs for mindful investors to monitor in the coming weeks.
VanEck Vectors Semiconductor ETF (SMH)
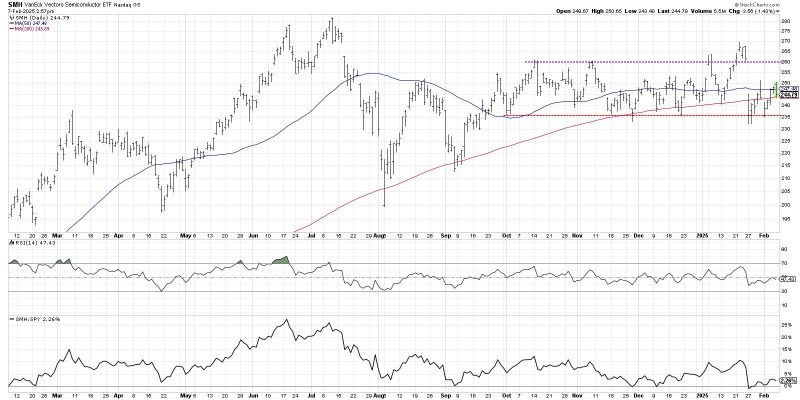
To be honest, the 2024 bull market was dominated by the AI theme, and the AI theme is dominated by semiconductors. At least, that was the prevailing narrative until news of Deepseek AI from China brought that entire thesis into question. From a technical perspective, semiconductors last made a new all-time high in July 2024, and in recent months has settled into a consolidation phase.
We can see the SMH rotating between support around $235 and resistance near $260, creating a rectangular consolidation period on the chart. The moving averages are almost completely flat, and the RSI has an almost perfectly neutral rating at 50. That is the definition of a sideways chart, from top to bottom.
The key with a consolidation phase is to either use swing trading techniques to play movements within that pattern, or just patiently wait for the price to finally break out of the well-established price range. I have alerts set for the SMH to break above $260 or break below $235, and, until one of those levels is finally broken, the chart is telling me to look elsewhere for opportunities.
Costco Wholesale Corp. (COST)
While groups like semiconductors have entered into a clear consolidation phase, big box retailers including Walmart Inc. (WMT) and Costco Wholesale Corp. (COST) have shown a strong beginning to 2025 after a very successful bull run in 2024.
Regardless of what I think of the broad market conditions, I’m always going to want to own good charts that keep going higher. As I love to sign off my daily market recap show, “It’s always a good time to own good charts!”
So what is it that makes COST and other similar charts in the consumer staples sector so attractive from a technical analysis perspective? I think it starts with the trend, and COST has been pounding out a fairly consistent pattern of higher highs and higher lows for 18 months and counting.
What’s most encouraging as we enter the month of February is the improvement in relative strength. COST is making new highs while other charts, such as our next example, are pulling back from recent all-time highs. At a time when it feels like stocks are beginning to struggle, I’m always looking for charts like Costco that are continuing their uptrend phase with higher highs and higher lows.
Alphabet Inc. (GOOGL)
Our third chart highlights the reality of the Magnificent 7 stocks in early February, with more and more of these previous leadership names beginning to show clear signs of negativity. Earnings season has not been kind to companies like Alphabet, who, despite beating earnings estimates for the quarter, provided a less optimistic forward projection for future earnings growth.
GOOGL gapped lower on Wednesday after making a new all-time high into earnings on Tuesday. After initially finding support at the 50-day moving average, Alphabet broke below the 50-day on Friday’s trading session. The gap lower this week also accentuated a bearish momentum divergence, with GOOGL’s higher price highs in February marked by a decline in momentum. Higher prices and lower RSI are a common feature of a late stage bull market, when stocks are still moving higher but the momentum behind those gains has begun to wane.
While GOOGL still remains above an upward-sloping 200-day moving average, and still appears to be holding trendline support based on the September and November swing lows, this week’s drop on forward guidance certainly has investors wondering where assets could flow if they’re no longer supporting mega-cap growth stocks like GOOGL.
For the remaining seven stocks, along with lots more comments and insights on this market transition phase in February, head over to my YouTube channel!
RR#6,
Dave
P.S. Ready to upgrade your investment process? Check out my free behavioral investing course!
David Keller, CMT
President and Chief Strategist
Sierra Alpha Research LLC
Disclaimer: This blog is for educational purposes only and should not be construed as financial advice. The ideas and strategies should never be used without first assessing your own personal and financial situation, or without consulting a financial professional.
The author does not have a position in mentioned securities at the time of publication. Any opinions expressed herein are solely those of the author and do not in any way represent the views or opinions of any other person or entity.
