While 2024 was defined by the strength of the Magnificent 7 stocks, 2025 has so far been marked by a significant change of character on many of these former high flying growth names. And while most remain in constructive long-term patterns, the short-term changes make me skeptical of further market upside without the support of these mega cap players.
Let’s group these charts into three buckets: the top performers, the broken charts, and the diverging darlings.
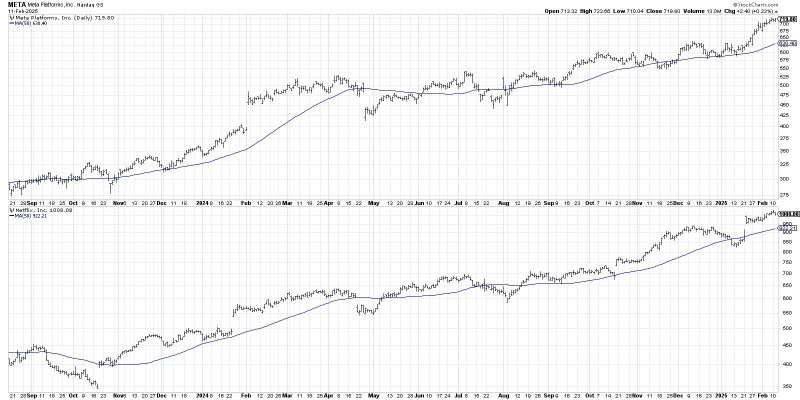
The Top Performers: META and NFLX
This first bucket features two stocks that are moving higher in 2025 just like they did for much of 2024. While the remaining stocks on this list have experienced some change of character, these are the names that remain in consistent uptrend phases.
Both Meta Platforms (META) and Netflix (NFLX) have achieved new all-time highs in February, with strong earnings calls serving as the latest catalyst for price appreciation. Both charts remain above upward-sloping 50-day moving averages, and as long as they continue to make higher highs and higher lows, they should be considered innocent until proven guilty.
The Broken Charts: TSLA, AAPL, MSFT, and NVDA
2025 has been much less kind to this second group of “Formerly Magnificent 7” names, as all four of them have pulled back from a strong 4th quarter performance. Apple (AAPL) in particular strikes me as a chart that is demonstrating a potentially catastrophic bearish price pattern, with a clear “line in the sand” to monitor in the coming weeks.
After rising to a new all-time high around $260 in late December, AAPL pulled back to find support at the early November low around $220. While the stock has bounced higher after that sudden 16% drop, a bearish engulfing pattern at the 50-day moving average at the end of January reinforced that this is a name most likely in a distribution pattern.
Now we have clear neckline support at the previous swing lows around $220. If AAPL is able to hold this support level, then we’d label this a consolidation phase and wait for further clarification. But if the $220 level is finally broken, that would complete a topping pattern and also represent a break of the 200-day moving average. A quick measurement would suggest a downside target around $190, representing a 27% drop from the December 2024 high.
The Diverging Darlings: AMZN and GOOGL
Now we’re left with two stocks that both feature a bearish momentum divergence, a pattern that has proliferated among US stocks in recent months. When prices make new highs on strong momentum, that suggests a healthy uptrend phase. But when prices make new highs on weaker momentum, this bearish divergence indicates a lack of upside follow-through and a high likelihood of a market top.
While Amazon.com (AMZN) still remains above two upward-sloping moving averages, the early February high is marked by a downward-sloping RSI. This bearish pattern could easily be negated if AMZN is able to achieve further highs on improving momentum. But the divergence looks very similar to other stocks that have experienced major tops.
In fact, Alphabet (GOOGL) featured a bearish momentum divergence going into last week’s earnings release. And while that certainly put GOOGL on a “red flag” watch list for me, the gap lower and subsequent post-earnings drop tells me that investors are questioning the long-term bull story for this former leadership name.
Similar to the AAPL chart, I would argue that the 200-day moving average could be the most important level to watch. A pullback to the 200-day moving average after an earnings miss could represent a decent retracement to set the stage for the next big move higher. But if stocks like AAPL and GOOGL fail to hold that the 200-day moving average, what would that tell us about investors’ risk appetite in February 2025?
To be clear, very few of the Magnificent 7 stock look truly negative from a long-term perspective, with most of them still within close proximity to a recent all-time high. But given how many of these former leadership names have experienced at least initial breakdowns from their recent highs, I’m starting to look elsewhere for opportunities on the long side.
RR#6,
Dave
PS- Ready to upgrade your investment process? Check out my free behavioral investing course!
David Keller, CMT
President and Chief Strategist
Sierra Alpha Research LLC
Disclaimer: This blog is for educational purposes only and should not be construed as financial advice. The ideas and strategies should never be used without first assessing your own personal and financial situation, or without consulting a financial professional.
The author does not have a position in mentioned securities at the time of publication. Any opinions expressed herein are solely those of the author and do not in any way represent the views or opinions of any other person or entity.
