Popular
Learning Painful Lessons is the Start to Building...
Crypto Market Review: Trump Media Planning US$3 Billion...
FPX Nickel and JOGMEC Initiate Exploration at the...
Cardiol Therapeutics to Webcast Virtual Annual General Meeting...
Bitcoin Well Announces Nostr Integration; Including Bitcoin Purchases...
Brazilian leader Lula released from hospital after suffering...
Hong Kong’s baby pandas finally get names. Meet...
Germany and other allies lift restrictions on Ukraine...
India approves stealth fighter program amid tensions with...
Floods wreak havoc on India’s financial capital as...
  • Home
HotInvestingPilots.com
  • Politics
  • World News
  • Stock
  • Investing
Stock

Double Tops on Bitcoin and the Dollar

by February 15, 2025
written by February 15, 2025

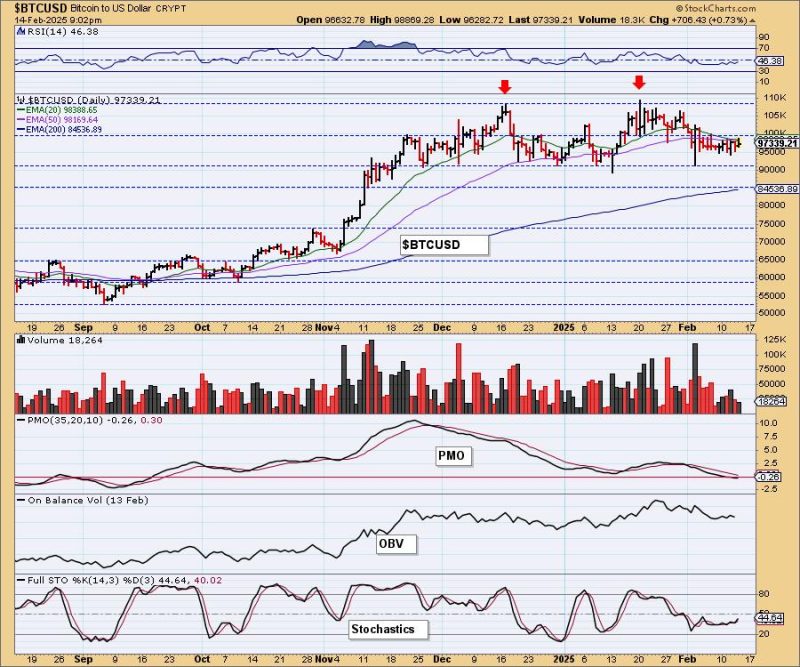
As part of the DP Alert, we cover Bitcoin and the Dollar every market day. We have been watching some bearish indications on both Bitcoin and the Dollar with the double top chart patterns.

On Bitcoin, price has been moving mostly sideways above support at 90,000. This happens to be the confirmation line of the double top formation. The chart pattern calls for a decline the height of the pattern, which would give us a minimum downside target at about 75,000. The PMO is now in negative territory, but we do see that Stochastics have turned up. Support could hold here and price could continue to meander sideways, but, with this pattern, it is highly vulnerable.

On the weekly chart we see a parabolic advance followed by high level consolidation that formed a bull flag. After the last rally powered price up, we aren’t seeing high level consolidation; it instead looks like a topping formation with the double top very visible. The weekly PMO is nearing a Crossover SELL Signal, which doesn’t bode well.

The Dollar also has a bearish double top visible on the daily and weekly charts. It looked pretty good for the Dollar coming out of a bullish flag formation, but the rally stalled and set up the second top. Technically, the confirmation line (middle of the “M”) has been broken with Friday’s action. The RSI is negative and the PMO is in decline. Unlike Bitcoin, Stochastics are moving lower, suggesting we will see more downside out of the Dollar. That would be good for Gold, which is already enjoying a strong rally. The minimum downside target of the pattern would be around 28.25.

We had an especially bullish breakout from a bearish rising wedge, but now we have that double top. The weekly PMO has turned down, and price looks as if it will be back within the wedge soon.

Conclusion: We have bearish double tops on Bitcoin and the Dollar. Bitcoin has an opportunity to avoid the breakdown given rising Stochastics, but the Dollar seems destined to continue to make its way lower with dropping Stochastics. Downside targets are 75,000 for Bitcoin and 28.25 for the Dollar.


The DP Alert: Your First Stop to a Great Trade!

Before you trade any stock or ETF, you need to know the trend and condition of the market. The DP Alert gives you all you need to know with an executive summary of the market’s current trend and condition. It covers more than the market! We look at Bitcoin, Yields, Bonds, Gold, the Dollar, Gold Miners and Crude Oil! Only $50/month! Or, use our free trial to try it out for two weeks using coupon code: DPTRIAL2. Click HERE to subscribe NOW!


Learn more about DecisionPoint.com:


Watch the latest episode of the DecisionPointTrading Room on DP’s YouTube channel here!


Try us out for two weeks with a trial subscription!

Use coupon code: DPTRIAL2 Subscribe HERE!


Technical Analysis is a windsock, not a crystal ball. –Carl Swenlin


(c) Copyright 2025 DecisionPoint.com


Disclaimer: This blog is for educational purposes only and should not be construed as financial advice. The ideas and strategies should never be used without first assessing your own personal and financial situation, or without consulting a financial professional. Any opinions expressed herein are solely those of the author, and do not in any way represent the views or opinions of any other person or entity.

DecisionPoint is not a registered investment advisor. Investment and trading decisions are solely your responsibility. DecisionPoint newsletters, blogs or website materials should NOT be interpreted as a recommendation or solicitation to buy or sell any security or to take any specific action.


Helpful DecisionPoint Links:

Trend Models

Price Momentum Oscillator (PMO)

On Balance Volume

Swenlin Trading Oscillators (STO-B and STO-V)
ITBM and ITVM

SCTR Ranking

Bear Market Rules


0 comment
0
FacebookTwitterPinterestEmail

previous post
Master Multiple Time Frame Analysis With This Simple Method
next post
Stash that Flash Right in the Trash

Related Articles

Automate Your Scans with Ease! Sample Scan Library...

May 24, 2025

3 Stocks to Watch While Everyone’s Staring at...

May 24, 2025

My Durable Advantage as an Investor is My...

May 24, 2025

S&P 500 Slide Explained: What Past Price Action...

May 23, 2025

MACD + ADX: Spot the Pullbacks Worth Trading

May 23, 2025

Learning Painful Lessons is the Start to Building...

May 27, 2025

What Happens When the S&P 500 Breaks Below...

May 25, 2025

Week Ahead: NIFTY Stays In Technically Challanging Situation;...

May 25, 2025

Moving from Thrust Signals to a Bull Market

May 24, 2025

What Happens When the S&P 500 Breaks Below...

May 24, 2025

Stay updated with the latest news, exclusive offers, and special promotions. Sign up now and be the first to know! As a member, you'll receive curated content, insider tips, and invitations to exclusive events. Don't miss out on being part of something special.


By opting in you agree to receive emails from us and our affiliates. Your information is secure and your privacy is protected.

Recent Posts

  • Brazilian leader Lula released from hospital after suffering vertigo

    May 27, 2025
  • Hong Kong’s baby pandas finally get names. Meet Jia Jia and De De

    May 27, 2025
  • Germany and other allies lift restrictions on Ukraine firing long-range missiles after Russia’s record aerial assault

    May 27, 2025
  • India approves stealth fighter program amid tensions with Pakistan

    May 27, 2025
  • Floods wreak havoc on India’s financial capital as monsoon rains arrive early

    May 27, 2025
  • About us
  • Contact us
  • Privacy Policy
  • Terms & Conditions

Copyright © 2025 hotinvestingpilots.com | All Rights Reserved

HotInvestingPilots.com
  • Politics
  • World News
  • Stock
  • Investing